Tuesday, 22 January 2013

Improving estimates with Planning Poker


I once overheard a comment regarding a last minute request to estimate a piece of work in an area of the code base the developer knew nothing about.  "Whatever you estimate, you'll be held to it.".  It's no wonder developers are often reluctant to provide estimates when there is an unrealistic expectation that estimates are always spot on.  An estimate by its own definition is an approximation and we should therefore anticipate and plan for the possibility that it is going to be incorrect.  What we can do however is employ techniques that help improve the quality and accuracy of estimates so that we can have a higher level of confidence in them.  One such technique is "Planning Poker".

Let's say we've been asked to estimate a particular user story in a large area of the system.  Different developers have had different experiences within this area and so their opinion of the complexity of implementing this user story differs.  Planning poker allows us to identify this and provide a forum for further short discussion; by the end of which we should achieve a more accurate estimate that everybody buys into.  Let's play a short hand to see this by example.

We have five stakeholders playing which consist of a two DBA's and three developers.  They all hold the following standard hand which contain numbers from the Fibonacci sequence.

Image courtesy of Mountain Goat Software


We have been asked to estimate two user stories and we'll play a hand to estimate user story 1 first.  Each stakeholder selects a card that represents their estimate of that story.  What we see after the first round are the following cards selected.  Two 1's, two 2's and a 3.  As the estimates from all were relatively close with no wildly differing opinions, the group decide to take the average(ish) estimate of 2 and move on.

Next we look at the second user story and get the following hand.  One 3, three 8's and a 13.  This time we have quite a split opinion so it is now up to the low and high scoring stakeholders to justify their estimates.  Once each stakeholder has presented, we go through the process of playing another hand, this time considering what we have just heard.  We repeat this cycle until we eventually reach a hand similar to the first where we had similar enough estimates that the group felt comfortable taking the average, if not the same estimate across the board.

As you can see, planning poker has the potential to be an effective tool in collaborative estimation.  It won't guarantee that every estimate will be perfect but it will improve the accuracy and reliability of them and certainly give you every possible chance of avoiding those unfortunate occasions where we get them wildly wrong.

Friday, 4 January 2013

The var keyword in C#. What's in your coding standards?

So this was a subject that led to much debate in the office this week.  When is it acceptable to use the var keyword in C#?  Well, lets start with the obvious situation where everybody will agree it is necessary and we have no choice otherwise.  Anonymous types.  

Take the following example where we have a Linq projection to an anonymous type...

var employeeDetails = from employee in employees
                where employee.County == "Kent" 
                select new { employee.ForeName, employee.Surname };

foreach (var item in employeeDetails)
{
    Console.WriteLine("Name={0} {1}", item.ForeName, item.Surname);
}


var is used twice here.  Once to hold a sequence of anonymous types, then again to iterate through the sequence of anonymous types; but where else is it appropriate for use?  Well actually, most people agreed that it shouldn't be used anywhere else.  It certainly shouldn't be used where it would cause ambiguity, like in the following example... 

var products = _repository.GetProductsByCategory(ProductCategory.Bike);

What is the type of the variable products in the example above?  It's not immediately obvious and requires you to drill down into the method GetProductsByCategory to determine the return type.  Instead, the use of an explicitly typed variable is preferred.  Here is the same example typed correctly. 

IList <IProduct> products = _repository.GetProductsByCategory(ProductCategory .Bike);

Much better.  Also, I don't think var should be used where the type is inferred from the right side of an assigmnet.  i.e...

var age = 31;

Sure, we know the implicit type of the variable age through our own experience, but what about junior members of your team?  Will they know?  Perhaps this was written by a junior.  Did they know the implicit type they would receive when they wrote this?  Were they expecting something else?  Its use here raises too many questions and is best avoided.

I think the biggest split in opinion was around using var when instantiating an object.  To be honest, I've always found C# rather verbose when it comes to this.  For example...

List<Bike> bikes = new List<Bike>();

Isn't there quite a bit of redundancy there?  We explicitly type the variable bikes, then we immediately instantiate that variable, specifying the type a second time.  Personally, I fall into the camp where if the type is specified on the right side of the assignment, use the more concise syntax of...

var bikes = new List<BikeDTO >();

To me, that reads much better.  It's concise and there isn't any ambiguity over the type.  This point however seems to split the room and there seems no way to convince either side otherwise.  I guess this one comes down to what you are used to and what other languages you have had exposure to.  The same verbose declaration in VB for example would look something like...

Dim bikes as List<BikeDTO> = new List<BikeDTO>()

However, nobody would ever use that syntax.  Instead, the norm would be to use the conciser form of...

Dim bikes = new List<BikeDTO>()

...and move on.

Ultimately, the standard you choose should be consistent and not cause the developer to think too much about it, either at the point of variable declaration or variable discovery.  It's important to settle on something that everybody will buy into and adhere to.  I think it's impossible to please everybody on this one so if permitting its usage for the sake of reducing redundancy is going to cause debate and inconsistency within your code base, perhaps go with the safest option and don't permit it.

What do your coding standards say about the use of var?

Thursday, 20 December 2012

Historical Debugging (Part 3) - IntelliTrace

When I first saw IntelliTrace introduced in Visual Studio 2010 I was initially disappointed and passed it by.  Sure, it was petty cool to make this part of your ALM ecosystem.  For example, whenever a test within a Microsoft Test Manager session or a unit test during a CI build failed, an iTrace file could then be stored on the TFS server against the failure and pulled down by a developer to investigate.  For me though, this wasn't where the functionality had the most potential benefit.  With internal testing, we already know the boundaries and set the parameters to ensure the test will fail.  They are written right there in the test.  The real benefit for me is with identifying the unknown cause of a problem within a production environment.  This is exactly what Microsoft gave us with Visual Studio 2012 and the new IntelliTrace Collector.

So what is IntelliTrace?  Well, it's like memory dump analysis on steroids.  However, unlike dump analysis where you can only see the state for frames within the stack, i.e. method entry and exit points, IntelliTrace can be configured to collect data at a far greater verbosity, down to the individual call level.  This provides a debugging experience much closer to that of live debugging except that the state information has already been collected and you can't purposely, or indeed accidentally modify it.

Another great benefit of IntelliTrace, when you have it configured to do so, is the ability to collect gesture information.  This means you no longer need to ask the tester or client for reproduction steps as all the information is right there within the .iTrace file.

IntelliTrace can also be incredibly useful for debugging applications that have a high cyclomatic complexity due to the client reconfigurability of the product.  No longer do you need to spend an enormous amount of time and expense trying to get an environment set up to match that of the client's configuration; if it's even possible that is.  As we are performing historical debugging against an iTrace file that has already collected the information pertaining to the bug, we can jump straight in and do what we do best.

One of the biggest criticisms people have of IntelliTrace however is the initial cost.  The ability to debug against a collected iTrace file is only available in the Ultimate version of Visual Studio.  True, this is an expensive product but I don't think it takes too long before you see a full return on that investment and indeed become better off, both financially and by gaining a strengthened reputation to respond quickly to difficult production issues.  In the very least, I think it makes perfect economic sense to kit out your customer facing maintenance teams with this feature.

Now that IntelliTrace can be used to step through production issues, it has become a formidable tool for the maintenance engineer.  Along side dump file analysis, we have the potential to make the "No repro" issue a thing of the past; only rearing it's head in non-deterministic or load based issues.

Historical Debugging (Part 2) - Visualised Dump File Analysis

As I mentioned previously, "Live Debugging" i.e. debugging a system as you press the buttons and pull the leavers doesn't always allow you to reproduce the issue.  Much time can be wasted building what you believe to be a representative environment only to find the issue still doesn't occur.  This is where "Historical Debugging" has so many advantages.

One of my favourite historical debugging additions to Visual Studio 2010 was the ability to debug against a user mode memory dump.  These dump files have always been creatable using a tool such as ADPlus, WinDbg or more recently ProcDump but since the launch of Windows Vista/Server 2008, their creation has been even easier.  Simply right click on the process in Windows Task Manager and select the "Create dump file" option on the context menu.  In doing so, the dump file is then placed in your %temp% directory, i.e. {SystemDrive}:\Users\{username}\AppData\Local\Temp.

Note, you can only use the above method if your application is working in the same address space as the underlying os architecture. If you attempt to dump a 32bit application running on 64bit windows, you'll just be dumping the WoW64 process that your application is running within.  In this case, use one of the aforementioned utilities to create the dump.

Once you have a *.dmp file and as long as you have the associated pdb's for the process you dumped, you can simply drag it into your IDE and begin performing a historical analysis of the process as of when the snapshot was taken.  You'll be able to see the call stack of each thread in the dump and switch to any frame within each stack so that you can interrogate and analyse the variables within the context of the source code and debugger visualisation tools you are already familiar with.  This is a vast improvement over the CLI based tools such as WinDbg with the SoS extensions used up until this point.

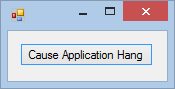
So lets see this in action.  I have put together a simple WinForms application and put something in there to cause the application to hang.


Step 1: Run the application and trigger the action that will cause it to hang.


Step 2: Open Task Manager and observe the application is reporting as not responding.


Step 3: Right click on the process and select "Create dump file".


Step 4: Drag the created .dmp file into Visual Studio and perform the action "Debug with Mixed".


Step 5: Use the debugger tools to perform a historical analysis of the variables.


As you can see from the last screen shot, the hang was simply caused by an infinite loop and Visual Studio took us straight to it because that's the point in the code the process reached when we created the memory dump but this strategy is just as applicable to thread contention issues or indeed any other issue where analysis of a running production environment is required.

Dump file analysis used to be a hard going process and often avoided.  Now we have the ability to import these files into Visual Studio and interrogate the state using the tools we are already familiar with, this once again becomes a very valuable and powerful tool which can save an enormous amount of time and money diagnosing those "no repro" issues.

Friday, 14 December 2012

Historical Debugging (Part 1) - The end of the "No repro" problem?

If you think about it, with all the advancements that have been made within the software engineering industry over the last 40 years, debugging tools and strategies have not really advanced at the same pace.  Sure, parallelism has received a lot of focus in recent years and as such we have seen new debugging visualisers like the "Parallel Stacks" & "Parallel Tasks" windows in Visual Studio 2010 and the new "Parallel Watch" window in Visual Studio 2012 but by and large, debugging strategies have remained the same. Examine a stack trace; place some breakpoints in the associated source and try to reproduce the issue.

How many times have we or our teams tried to reproduce an issue using the reproduction steps provided by QA or worse still, the client and not been able to do so?  More times than I care to remember.  The problem becomes even harder to diagnose when the issue is data driven or caused by a data inconsistency issue and requires setting up an environment that closely represents that of the environment at fault.  We shouldn't be asking our clients for copies of their production data, especially if it contains sensitive customer or patient information.  So how do we debug issues we can't reproduce in a controlled development environment?  The answer, "Historical Debugging".

Historical debugging is a strategy whereby a faulting application can be debugged after the fact, using data collected at the time the application was at fault.  This strategy negates the need to spend time and money configuring an environment and reproducing the issue in order to perform traditional or "live" debugging.  Instead, the collected information allows us to dive straight into the state of the application and debug the issue as if we had reproduced it ourselves in our own development environment.

There have been two major Visual Studio advancements in historical debugging strategies over the last few years; "Visualised Dump File Analysis" and "IntelliTrace".  Both of these have made debugging production issues for maintenance and development teams simpler than ever.  Do they represent the end of the "No repro" issue?  Well between them, quite possibly and I'll discuss each of them in turn in the following two blogs..

Monday, 26 November 2012

Using metrics to improve product quality

Metrics. Managers love them. Developers hate them; but why is that? In a word, "trust". If we don't make clear from the beginning the intention of these metrics, distrust and resentment of them will set in and they will have a counter productive influence as developers begin to look for ways to "beat the system". The funny thing is, whether you're a manager or a developer, we all have one thing in common. We all want to improve the quality of the product and metrics when applied correctly help us all to achieve that. So how do we make metrics work?
  • Be transparent. Ensure you make clear the purpose of these metrics is to improve the quality of the product. Not to beat developers with a stick.
  • Focus on product quality, not individual performance. We all share that common goal so establish and capitalise on that alignment of interest. Do measure cyclomatic complexity and afferent/efferent coupling. Don't measure "most check-ins a week" or "most lines of code".
  • Create buy-in. Don't force these down. Identify meaningful metrics by utilising the experiences of those closest to the issues.
If we focus on the wrong metrics, we risk creating a culture where we write code that's purpose is simply to pass fool a rule. This is entirely different to writing clean, maintainable code which is where the real benefit is. Worst still, if metrics are used incorrectly as developer KPI's, no developer is ever going to undertake that much needed refactor of that difficult to maintain code for fear that it will hurt their "score" or "ranking". When we get to that point, it's the beginning of the end.

What other ways can you ensure metrics succeed within your team?  What metrics do you capture?

Saturday, 24 November 2012

Is management training only for managers?

Think about some of the tools and concepts we use...
  • Cultivating relationships 
  • Task, time and workload management
  • Management reporting

Are these really concepts that are only applicable to managers?

Developers, BA's, testers, they all have something in common.  They all need to interface with other areas of the organisation or perhaps even externally with clients.  They should all therefore be preparing for influence by cultivating relationships, ideally before they really need them.  It may seem like common sense, most management techniques are when you think about them, but why does this only become part of the curriculum for management when it's execution can have so much benefit earlier on in one's career?

We learn about visualising and managing our own workload.  Whether this be through maintaining simple task lists and calendar appointments in Outlook to more sophisticated mechanisms employing spreadsheets or personal kanban's, but why shouldn't these tools be applied at every level?  Managing your workload and identifying "what do I want to complete today?" ensures you don't face an endless list of tasks on a daily basis.  This reduces stress, creates a sense of achievement and therefore breeds a happier and in-turn more productive employee. 

What about management reporting?  We may use this to highlight to our own manager the issues impeding the effectiveness of the team we are responsible for but why do we need to be a manager of people before management reporting becomes an effective tool?  Perhaps you manage or are responsible for a particular process which is being impacted by external influences?  Perhaps you are a busy developer or product tester but can't deliver what's being asked of you because the hardware is under powered or the tools you were provided are not up to the task?  Everybody faces impediments to whatever it is they are responsible for and therefore I always encourage some form of reporting mechanism with every member of my team.  It doesn't have to be a comprehensive report with fancy formatting and pretty charts.  It could be as simple as a quick email at the end of each week listing the "Top 5 Impediments" they faced.  Of course, a lot of this should come out of other mechanisms such as Daily Scrums or weekly one-to-one's but you'll be amazed just how many great opportunities for improvement are highlighted by such a simple reporting mechanism which is complied as the issues occur, then forwarded to you at the end of the week.

As we can see, these are powerful tools which could help improve the productivity and personal progression of all members within your team.  Why not utilise your own coaching mechanism to share these and pay it forward?  In doing so, it will also assist you with the building of your own succession plan; ensuring you have great internal candidates to fill that vacancy you leave when your own career progresses.

What other tools do we learn through management training that could be applied earlier on in our careers?