Note, you can only use the above method if your application is working in the same address space as the underlying os architecture. If you attempt to dump a 32bit application running on 64bit windows, you'll just be dumping the WoW64 process that your application is running within. In this case, use one of the aforementioned utilities to create the dump.
Once you have a *.dmp file and as long as you have the associated pdb's for the process you dumped, you can simply drag it into your IDE and begin performing a historical analysis of the process as of when the snapshot was taken. You'll be able to see the call stack of each thread in the dump and switch to any frame within each stack so that you can interrogate and analyse the variables within the context of the source code and debugger visualisation tools you are already familiar with. This is a vast improvement over the CLI based tools such as WinDbg with the SoS extensions used up until this point.
So lets see this in action. I have put together a simple WinForms application and put something in there to cause the application to hang.
 |
| Step 1: Run the application and trigger the action that will cause it to hang. |
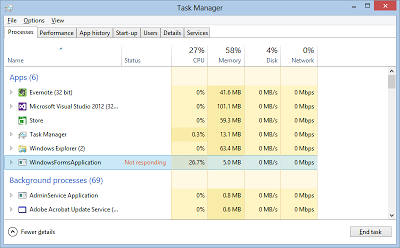 |
| Step 2: Open Task Manager and observe the application is reporting as not responding. |
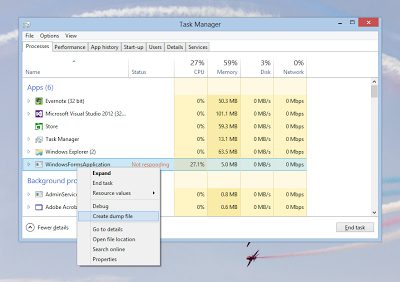 |
| Step 3: Right click on the process and select "Create dump file". |
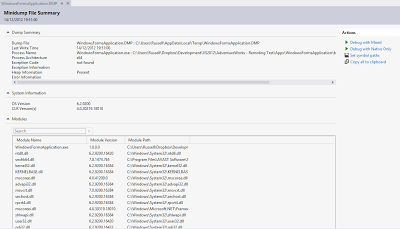 |
| Step 4: Drag the created .dmp file into Visual Studio and perform the action "Debug with Mixed". |
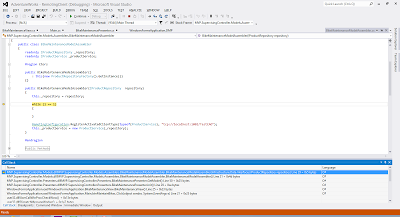 |
| Step 5: Use the debugger tools to perform a historical analysis of the variables. |
As you can see from the last screen shot, the hang was simply caused by an infinite loop and Visual Studio took us straight to it because that's the point in the code the process reached when we created the memory dump but this strategy is just as applicable to thread contention issues or indeed any other issue where analysis of a running production environment is required.
Dump file analysis used to be a hard going process and often avoided. Now we have the ability to import these files into Visual Studio and interrogate the state using the tools we are already familiar with, this once again becomes a very valuable and powerful tool which can save an enormous amount of time and money diagnosing those "no repro" issues.


No comments:
Post a Comment